Reports and Dashboards
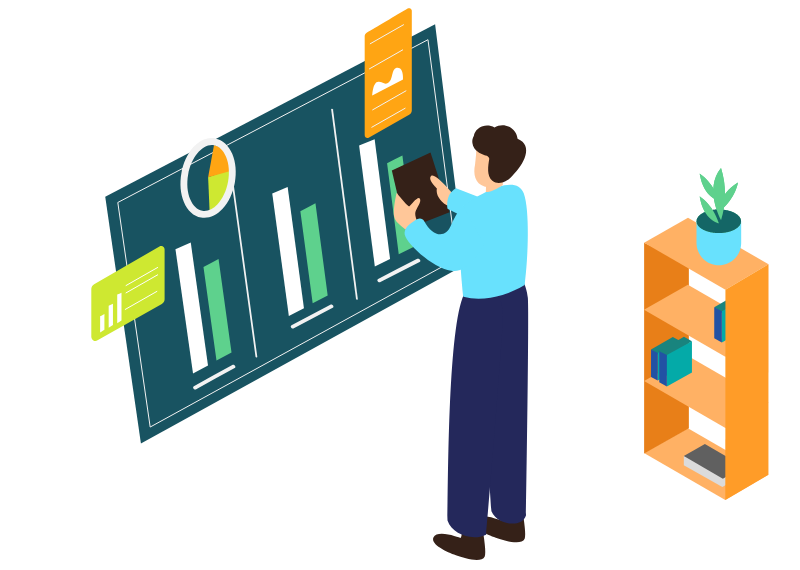
A visual and interactive progress view
Use dashboard views from comprehensive reports to generate powerful insights and present data that make a difference.
Our reports and dashboards have made life easy for users across multiple organizations
Powerful Reports
Visually comprehensive and powerful data insights
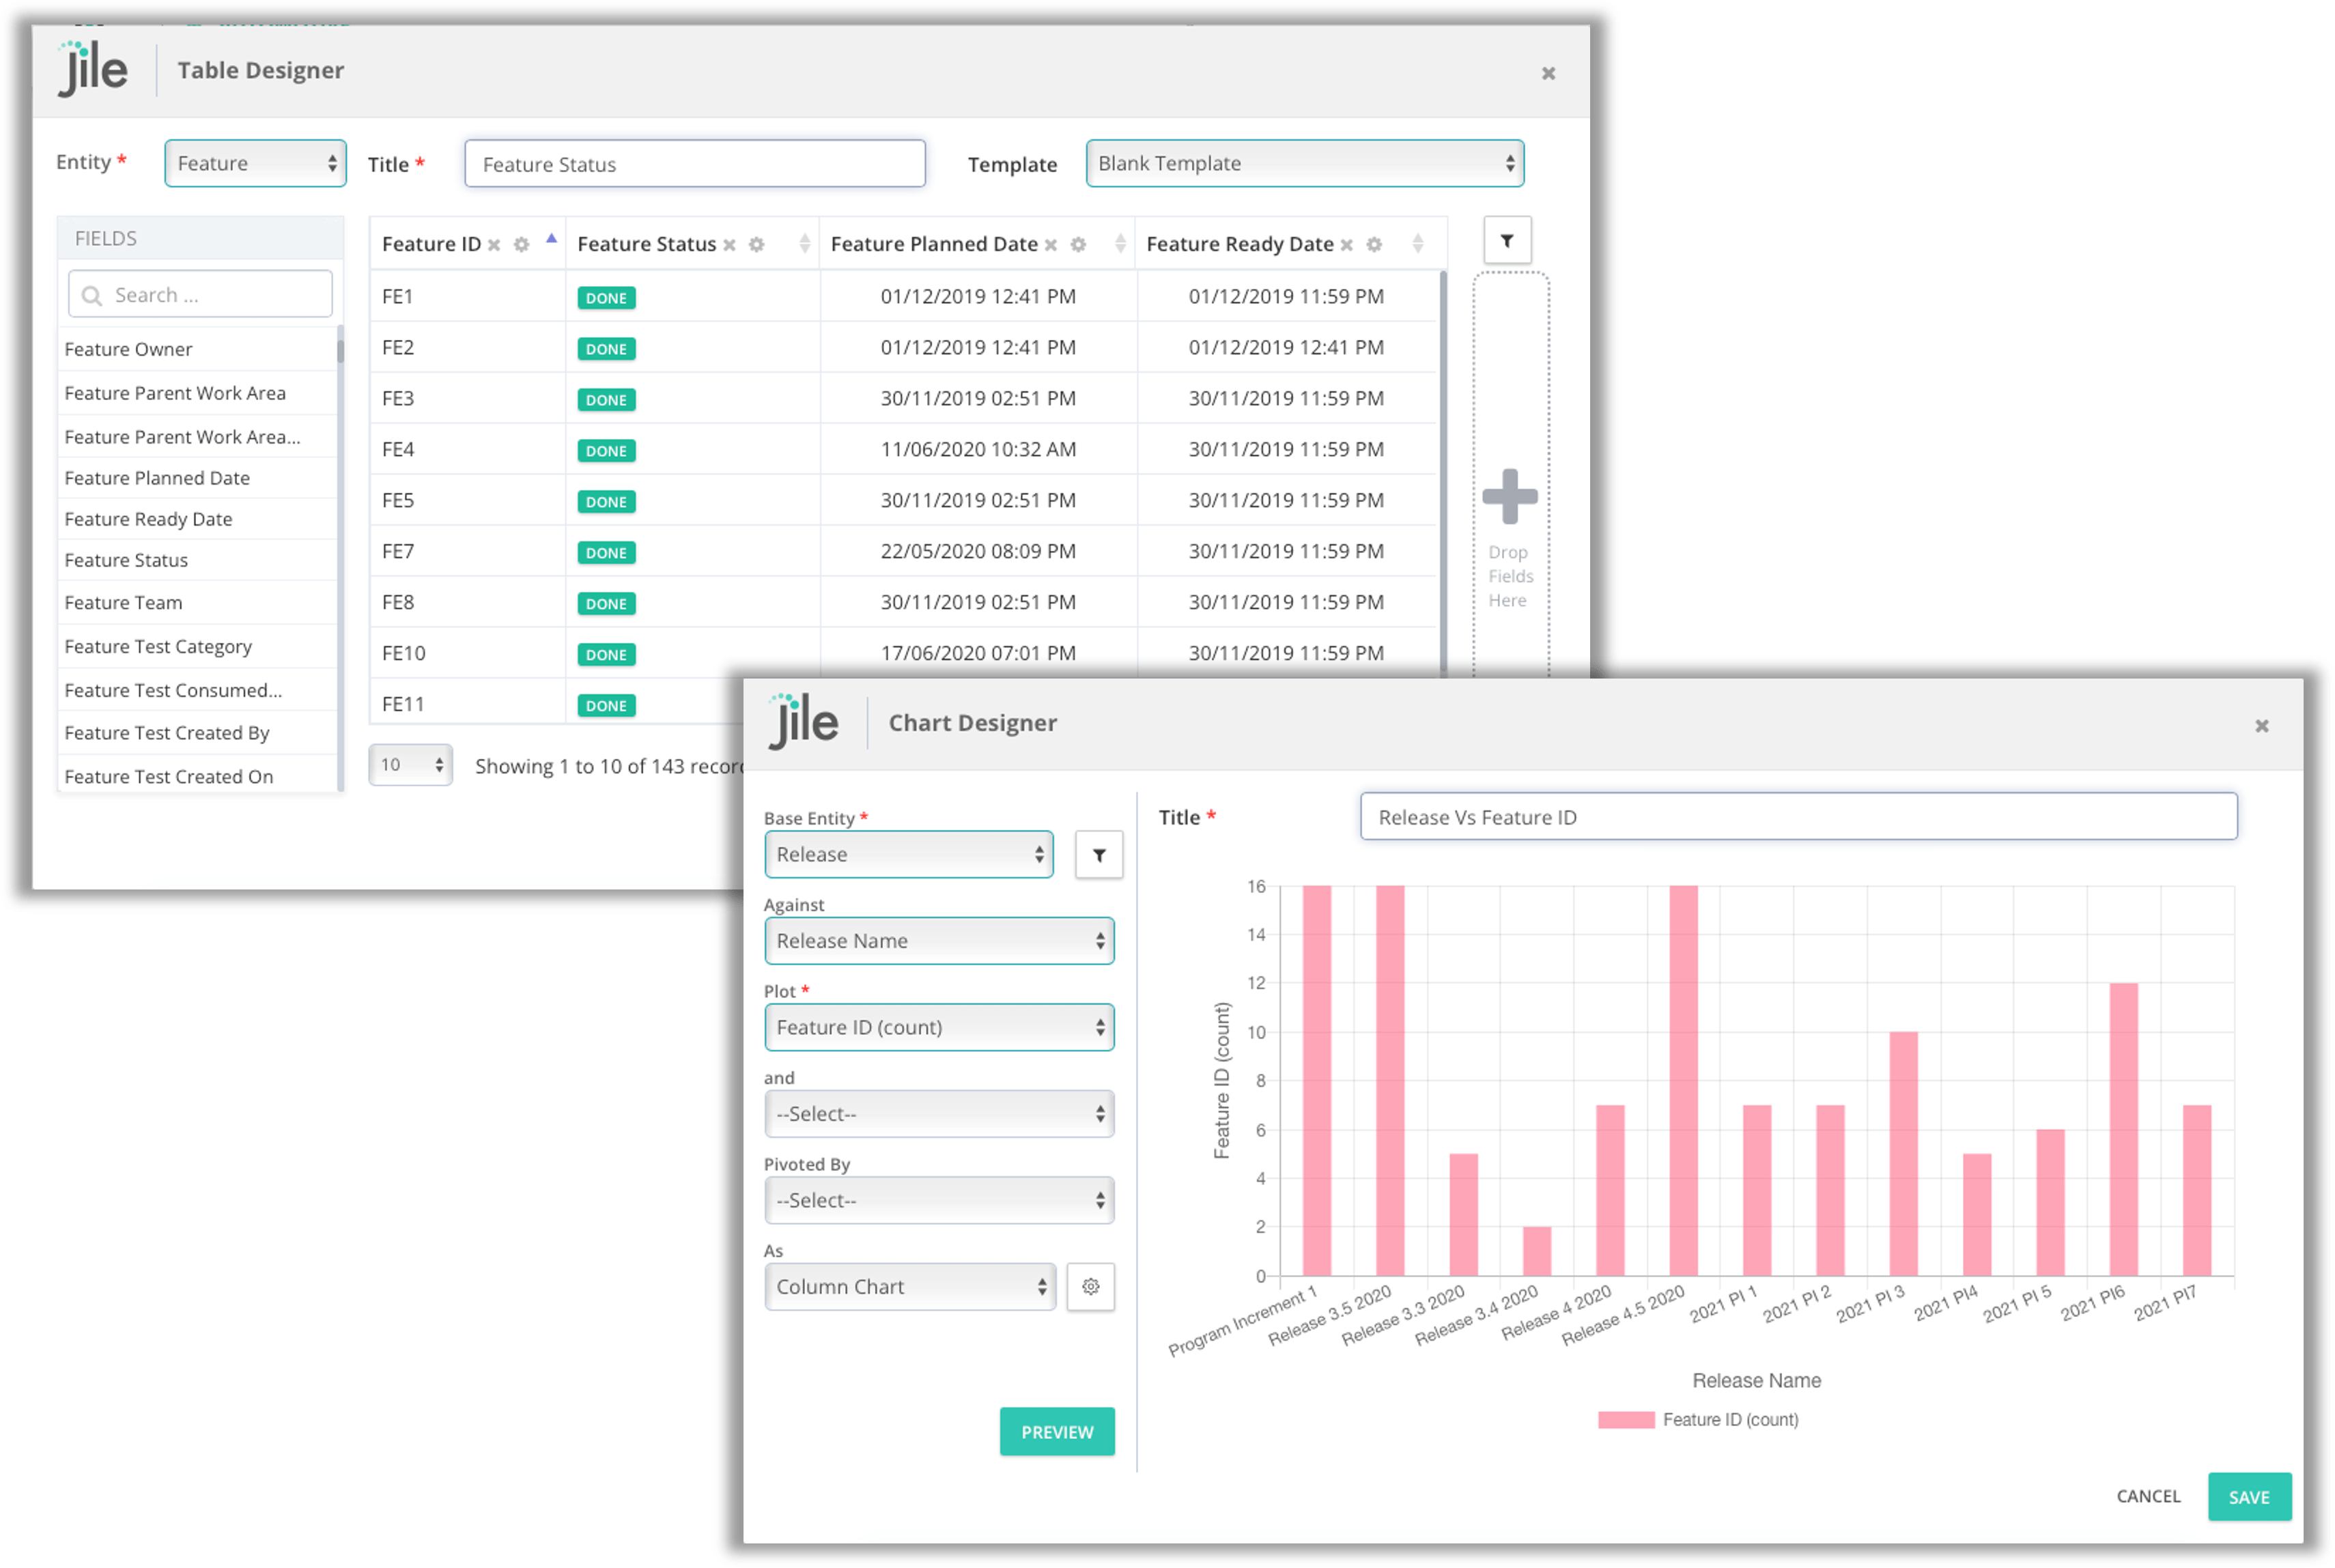
Use the configurable Analytics App to generate your own reports, leveraging the Report Designer. Select data from any entity and use functions such as pivoting and summing for data analysis. Categorize reports as public or private.
You can use the visual drag and drop capabilities to create custom reports from any data. Easily share the data from the report to build smart dashboards. Widely used by program, portfolio, and product managers.
Reports with complete visibility
Visually enhanced reports provide an end-to-end visibility of actionable insights. Save all your reports in one place. The data from the reports can be easily exported to spreadsheets.
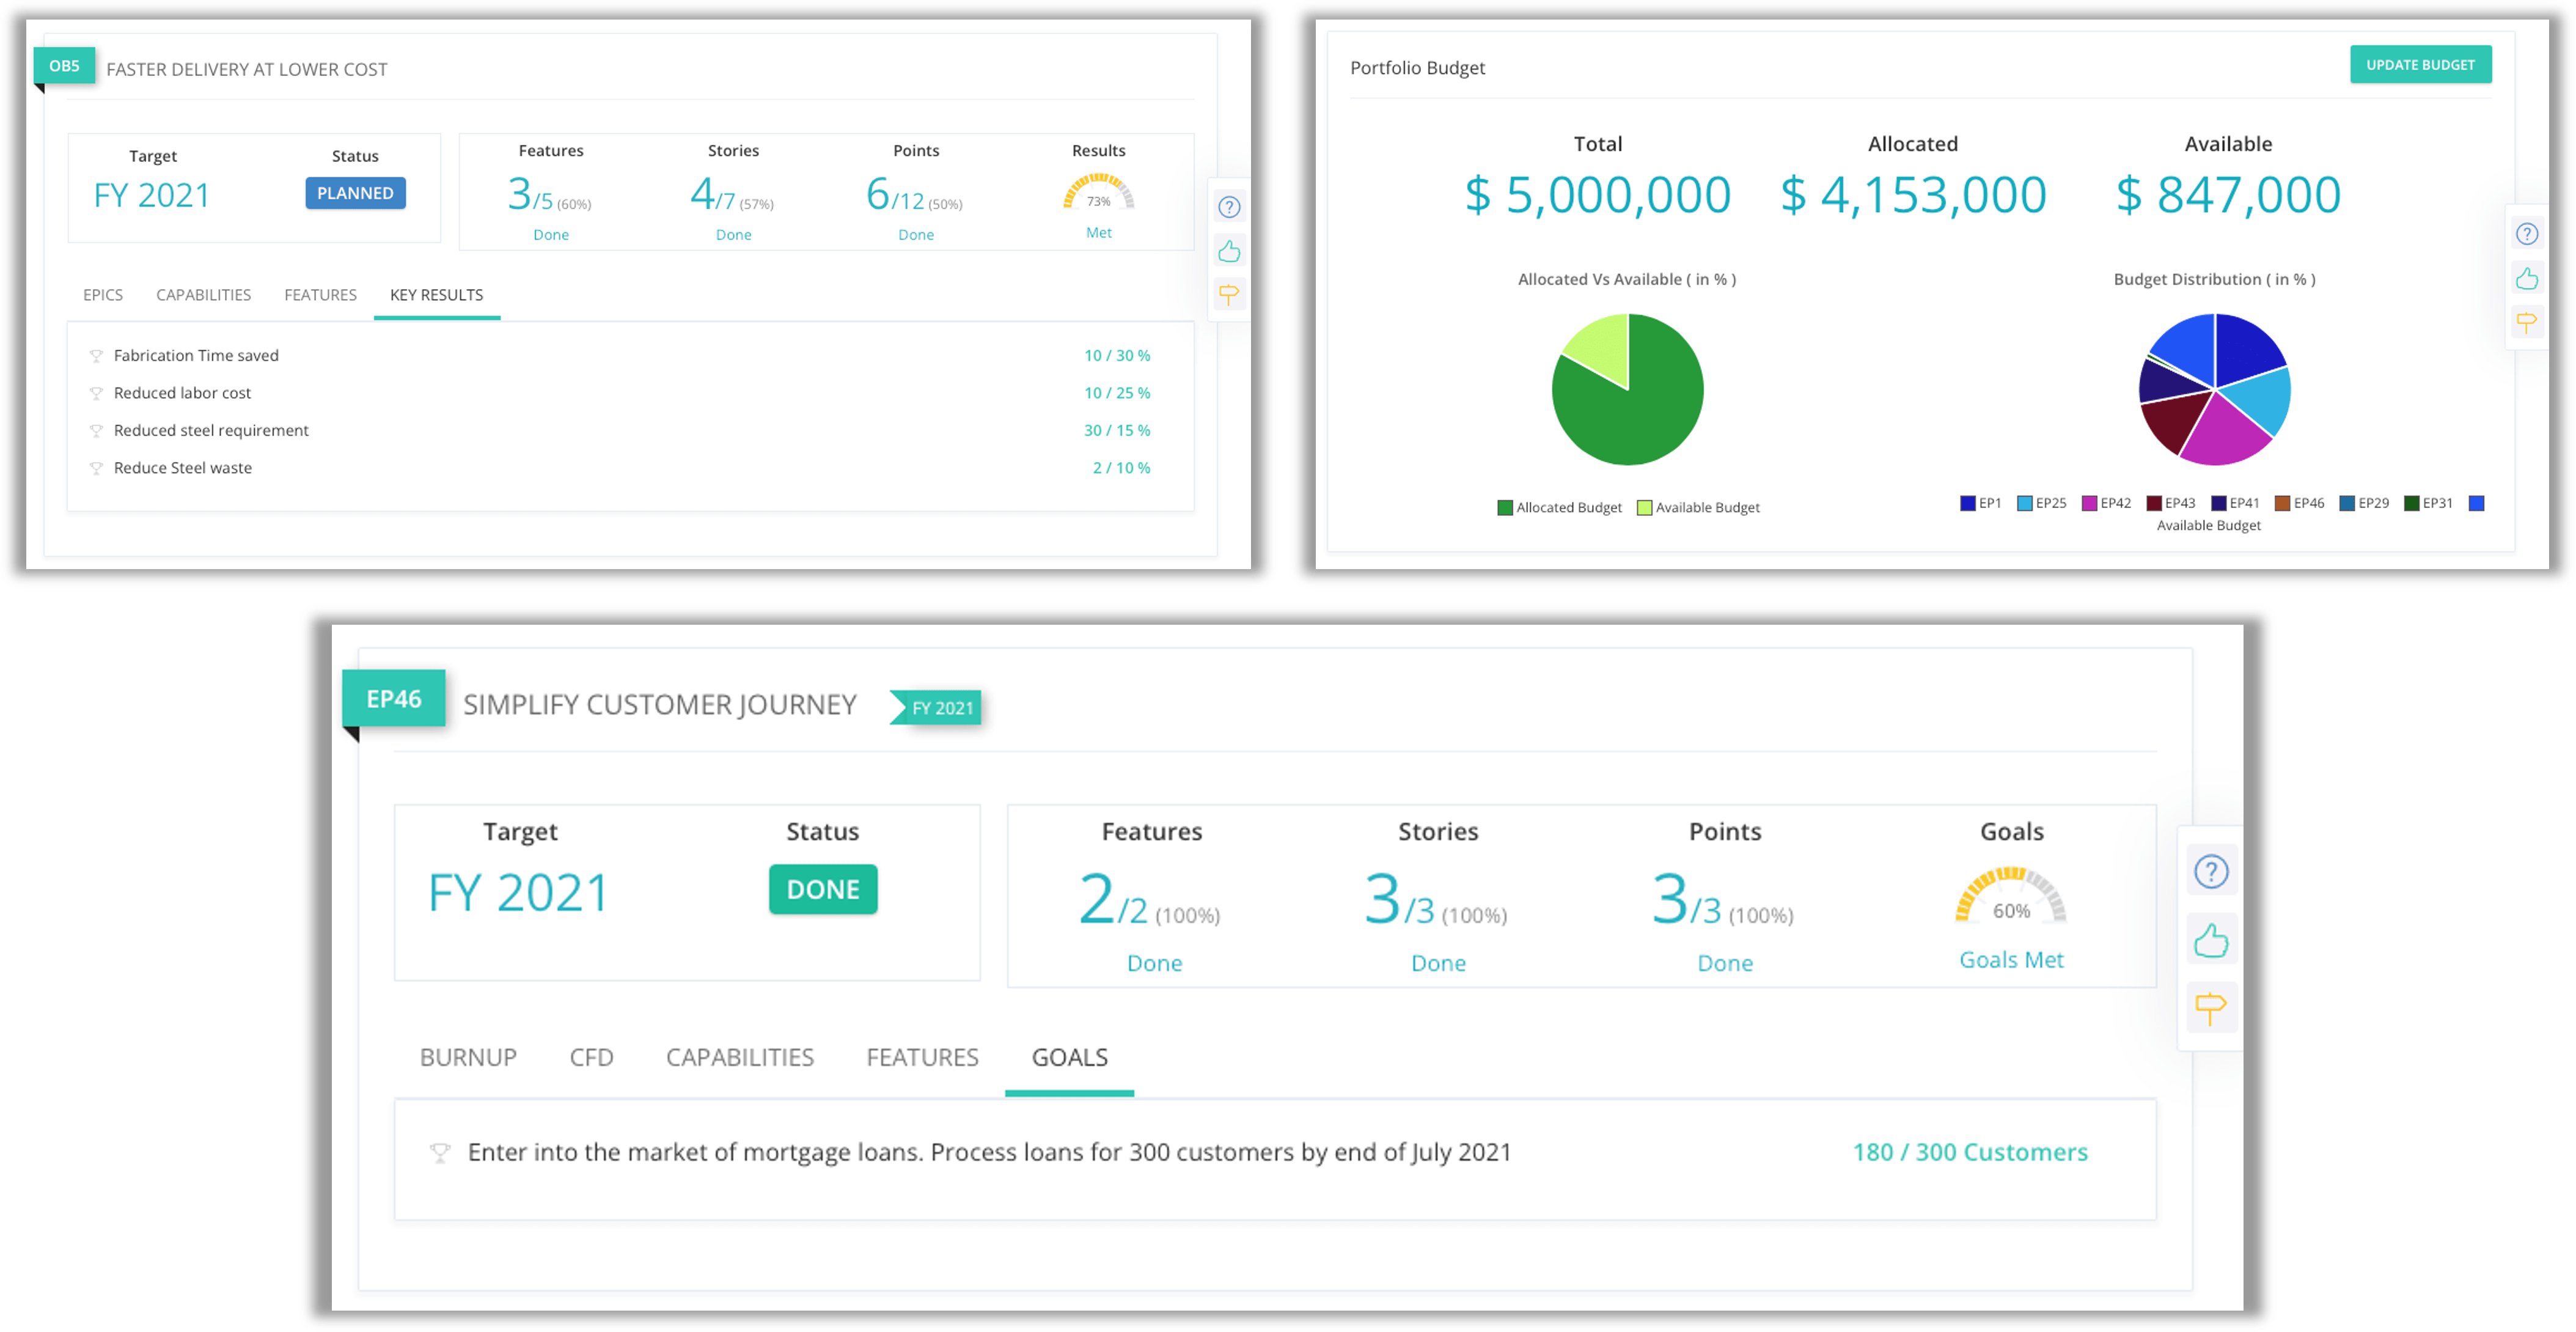
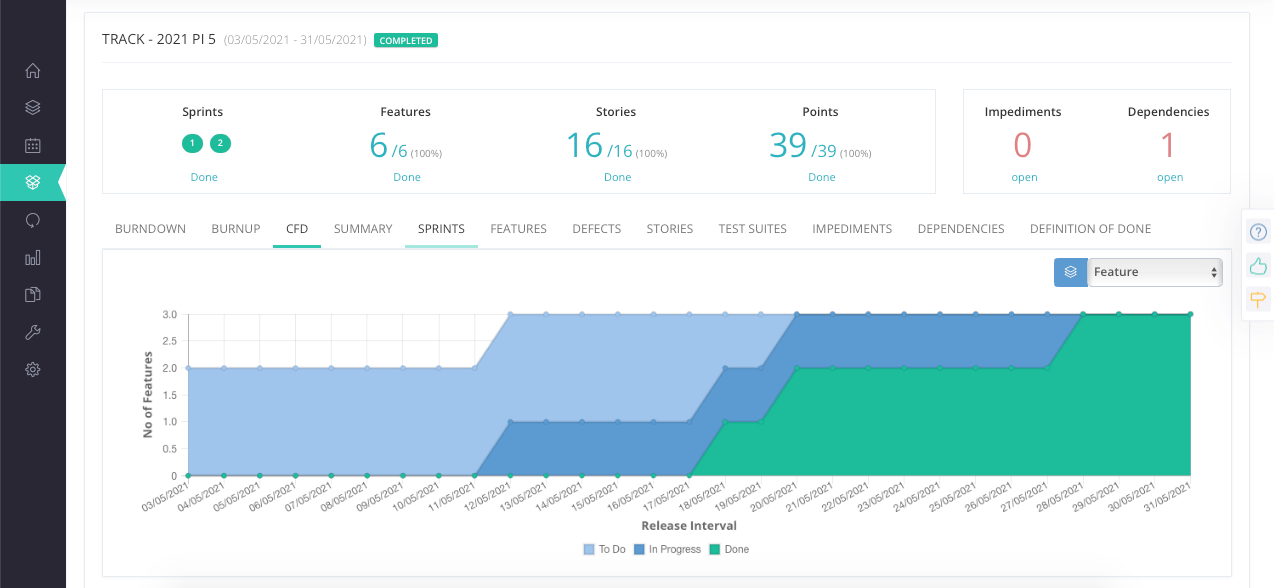
Release Progress
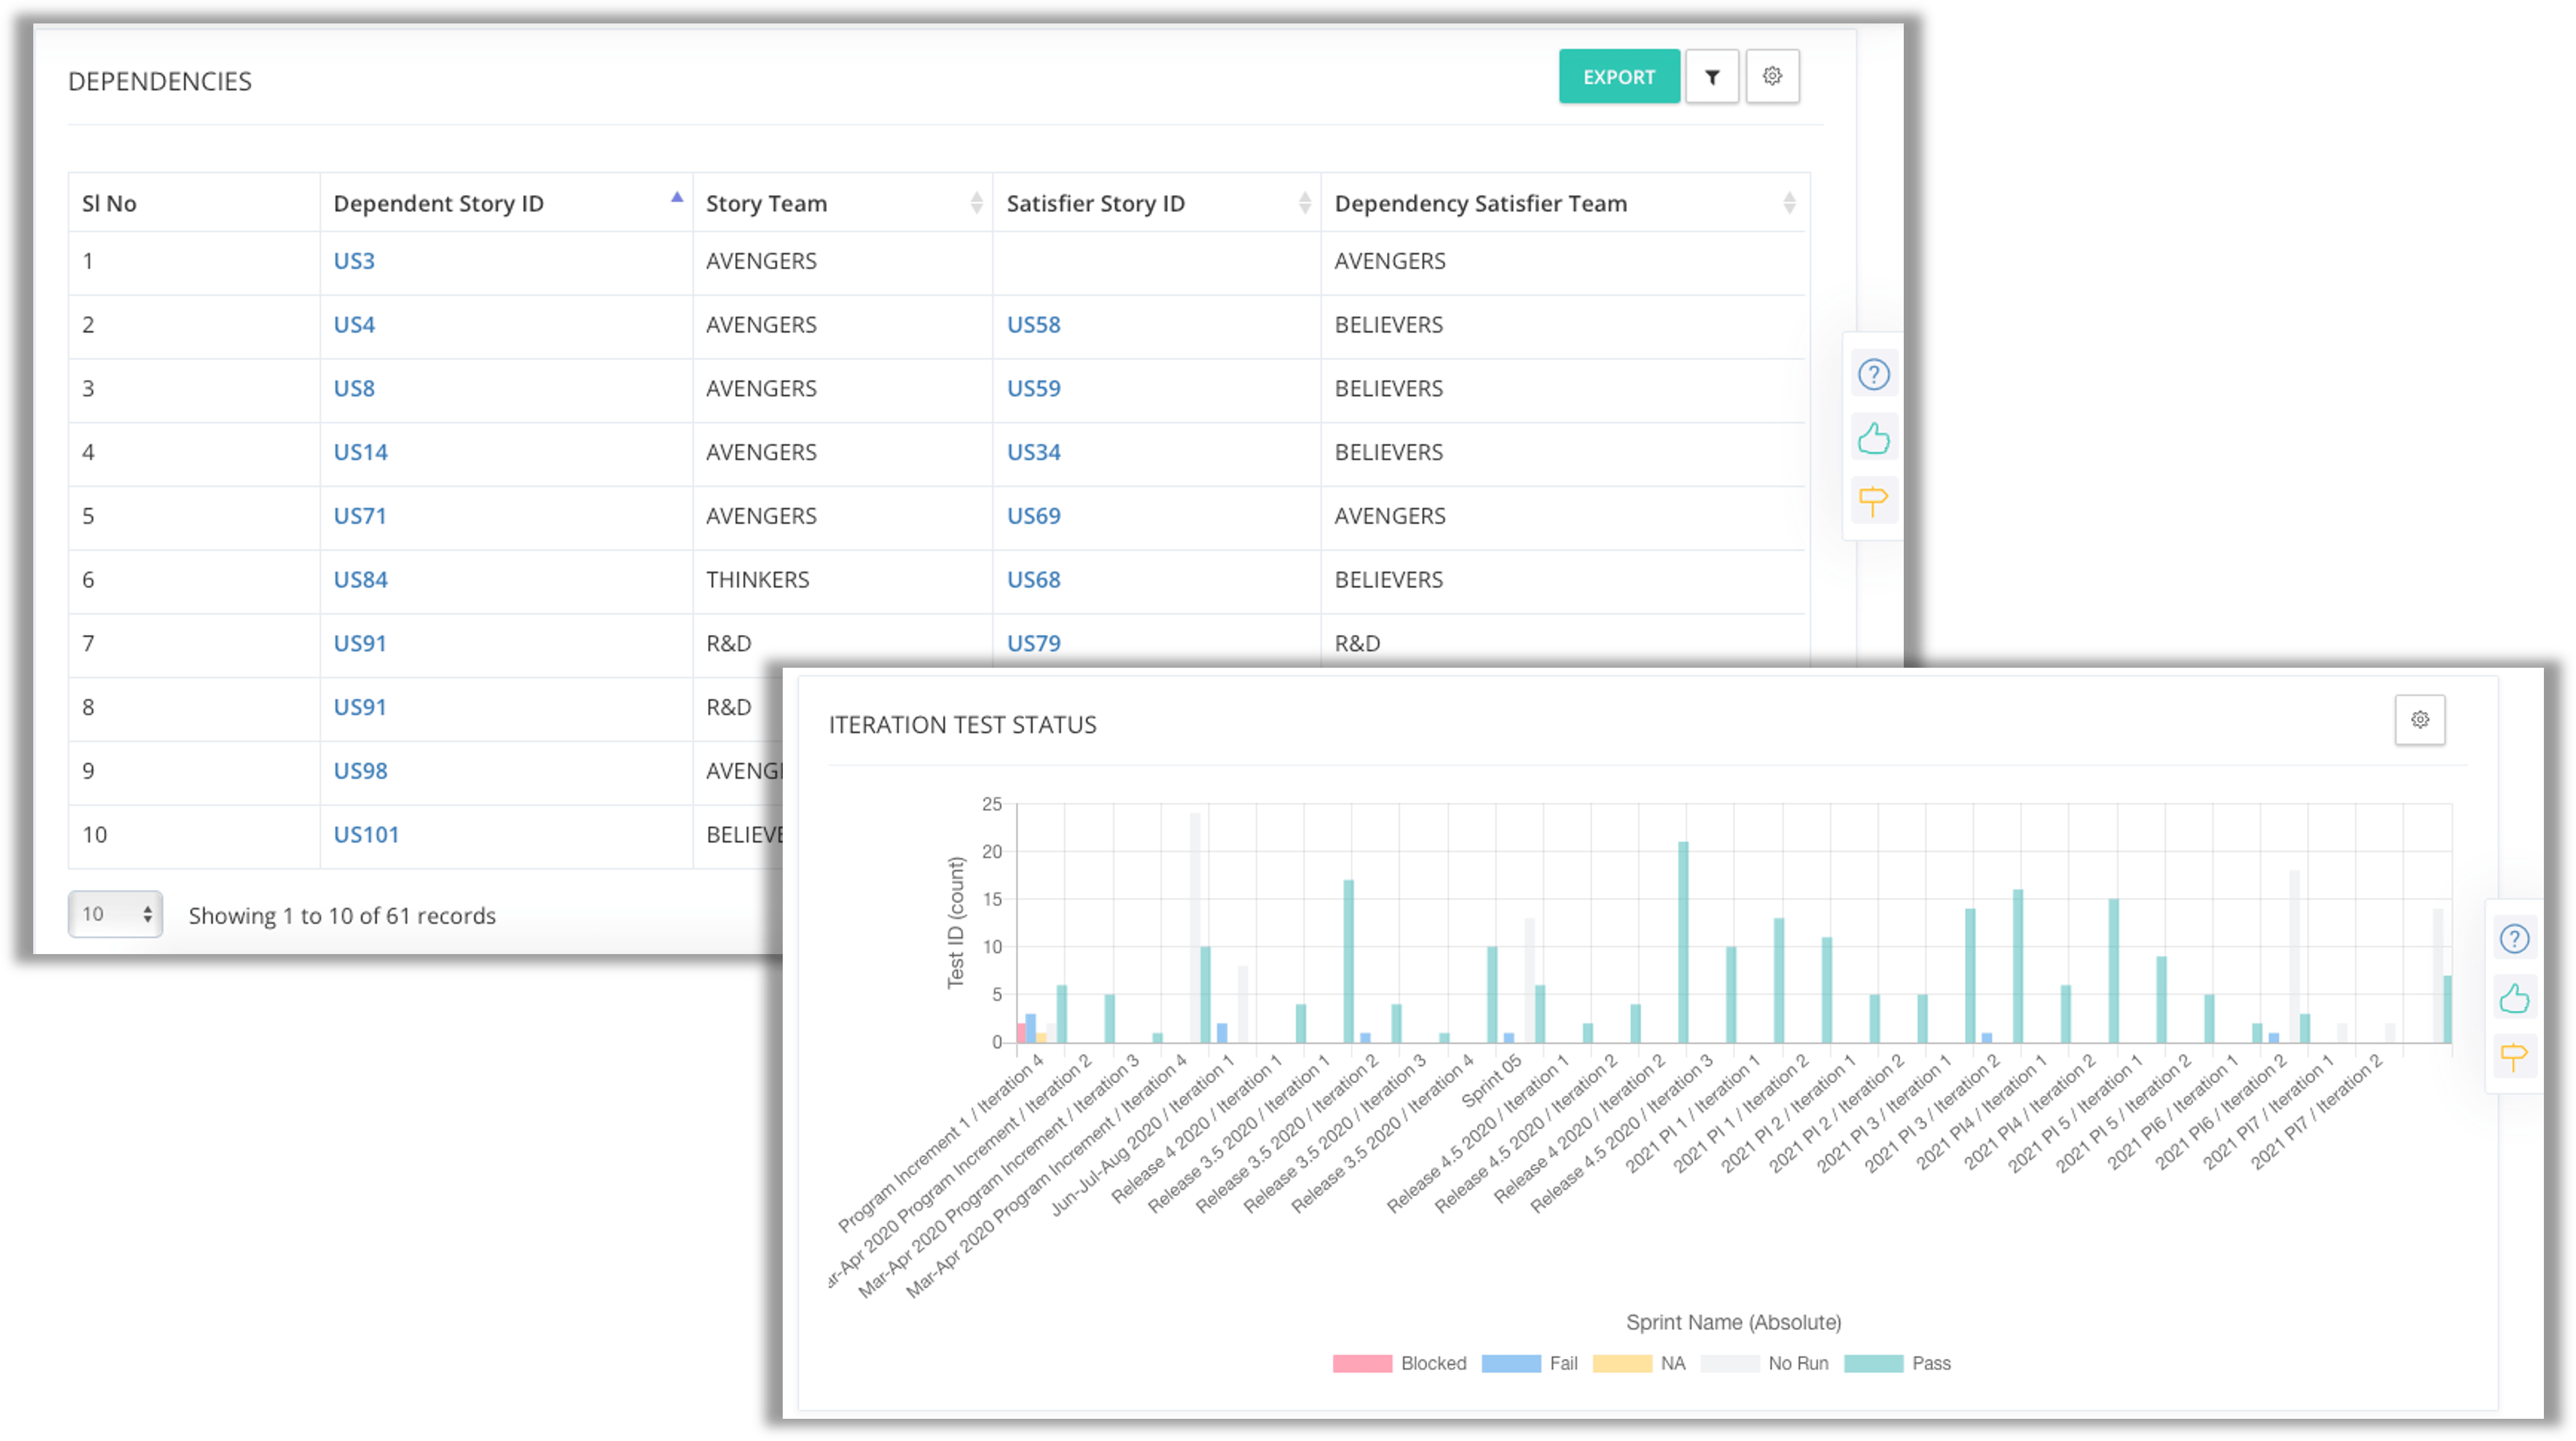
Use out-of-the-box dashboard view for release progress which includes burndown charts, cumulative flow diagrams (CFDs), open dependencies, and impediments. Use the summary tab to view the progress of each team.
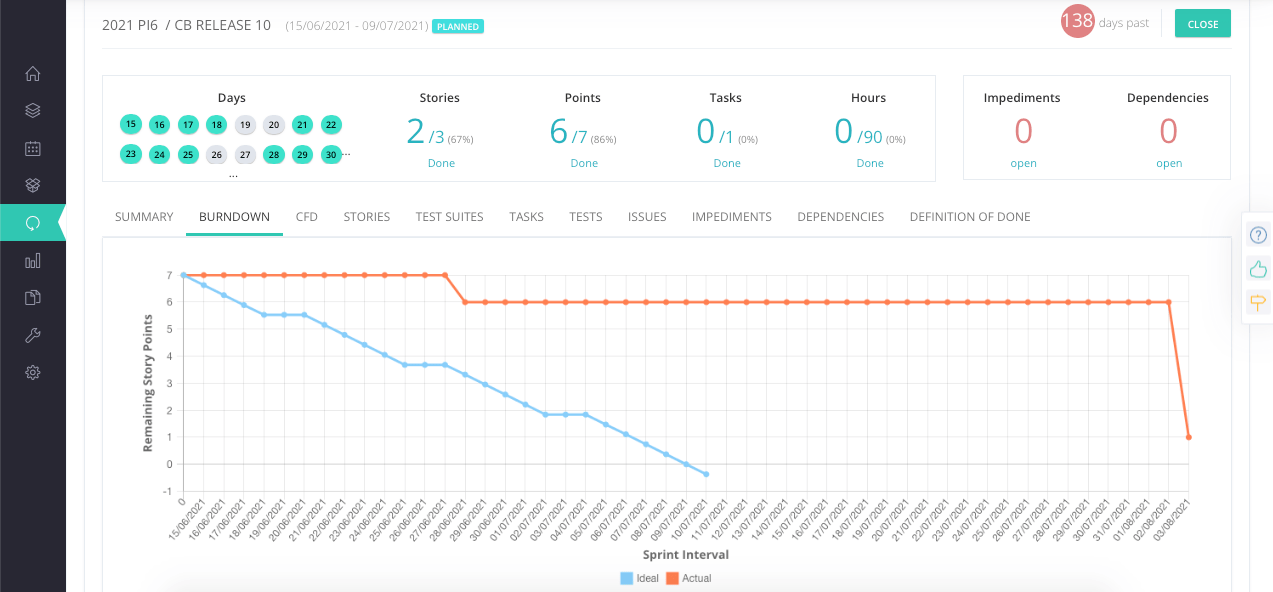
Sprint Progress
Track and evaluate status and progress of iterations with comprehensive metrics and charts. Out-of-the-box dashboard offers complete view of test, task, and issue summaries.
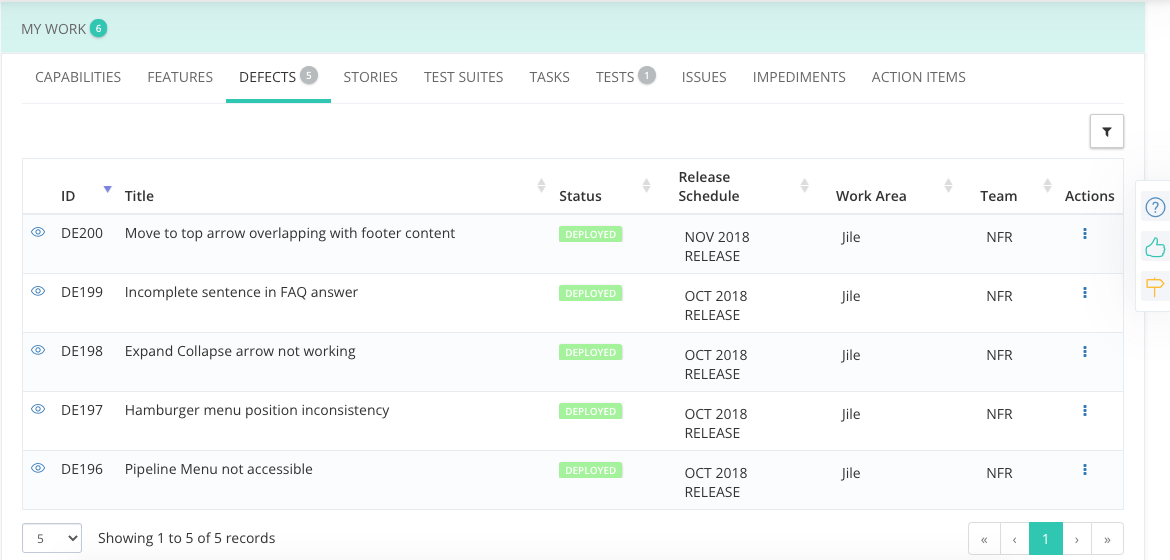
My work dashboard
Do more with an enhanced and superior dashboard, including viewing worklog for tasks, tests, and issues, and downloading attachments for all artifacts from the 'Quick View' option. Check the owner of each work item and view who it is pending with. Pull data across all work areas and teams on a single screen.
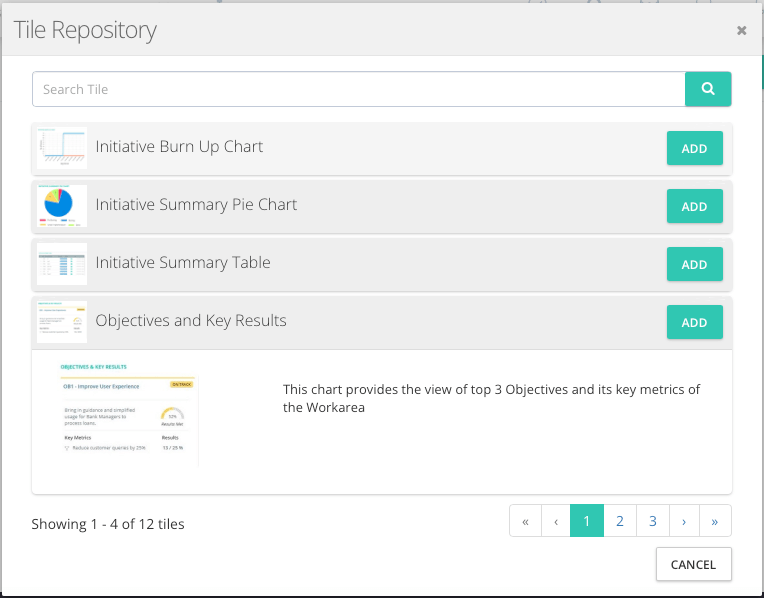
Custom Dashboard
App that makes a difference
Use the custom dashboard configurable app to personalize the dashboard to meet custom requirements and needs. Categorize reports as public or private.
Each dashboard consists of multiple configurable widgets for charts and reports. You can build your own chart and add it to the dashboard.
Something for everyone
Benefit from our visually holistic reports across roles and domains. Use all the enhanced features to manage your portfolio, program,and product. Refer reports according to your requirements.